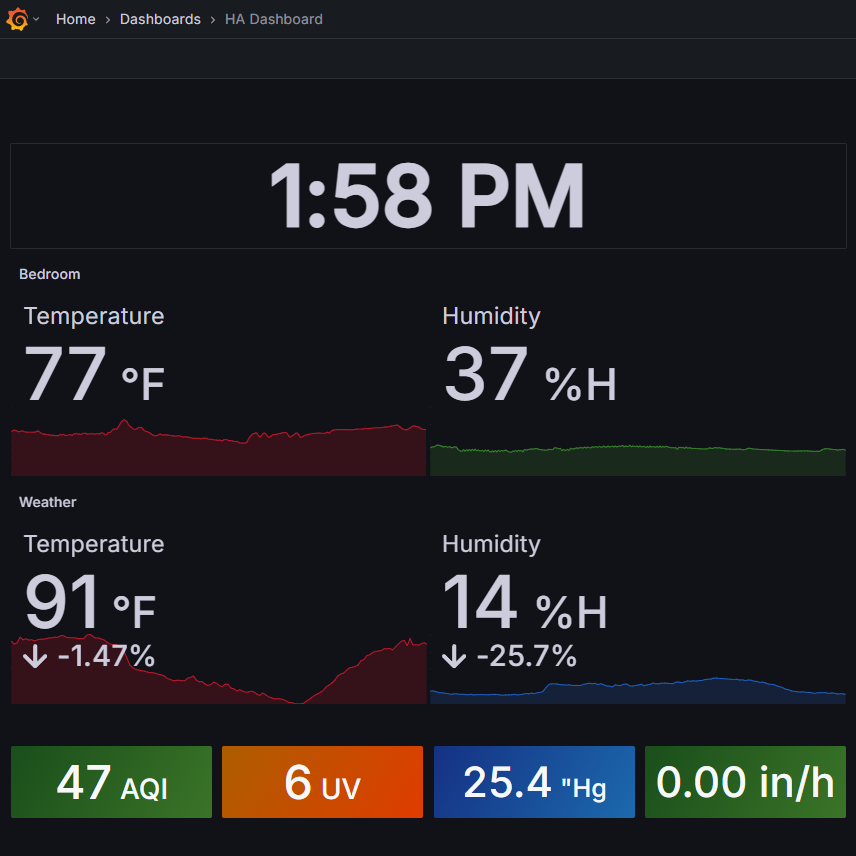
THE ULTIMATE SMART HOME DASHBOARD (GRAFANA) Overview: Deployed Grafana as a centralized dashboard platform for real-time data visualization. Integrated Home Assistant with InfluxDB to collect and store sensor and smart home data for historic analysis. Customized dashboards and visualizations within Grafana to monitor system metrics and sensors. Encrypted access using an Nginx reverse proxy and a local Certificate Authority. Grafana is the open source analytics & monitoring solution for every database. I love graphs, and who doesn’t? Okay, maybe it’s a niche interest, but for me, there’s nothing quite as satisfying as a good graph. So when I first heard about Grafana, I knew I had to give it a try. So, what is Grafana? Grafana is a web application that lets you connect to an external database and create interactive dashboards. The great thing is that the data source can be just about anything: computers, switches, network devices, and (my personal favorite) smart home sensors. Grafana takes all that data and consolidates it into a single dashboard, eliminating the need to troubleshoot across a dozen different tabs when hunting down a problem. For my setup, I started by connecting Grafana to Home Assistant. Home Assistant collects all sorts of sensor values, like whether my front door is open (again) or if the bathroom humidity spikes from an extra-steamy shower. I feed this data into InfluxDB, a time-series database that Grafana can easily understand. Once the data is in InfluxDB, Grafana can use the database for visualizations. To make it more secure, I put everything behind an Nginx reverse proxy. This keeps access to my dashboards encrypted. All in all, Grafana is a fantastic tool for monitoring all kinds of data and has been helpful more than once for observing trends and tracking down issues in my smart home automations. A graph for monitoring my temperature sensors over a 24 hour period