
AI-POWERED RAG SYSTEM LAB Overview: Developed and deployed an AI-powered Retrieval-Augmented Generation (RAG) system using OpenAI’s API, open-source OpenWebUI, and agentic tools written in python. Used SearXNG for anonymous internet queries as well as a vectorized database of my homelab notes for context-aware generation. Containerized the application stack using Docker on my homelab server for simplified deployment and maintenance. Overview of RAG process, combining external documents and user input into an LLM prompt to get tailored output. Credit Watching AI answer questions using your own notes as context feels like having a second brain—not literally, of course; that’s a different project. For this project, I decided to build a Retrieval-Augmented Generation (RAG) system for my homelab that can not only search my personal knowledgebase, but the internet as a whole as well. Using OpenAI’s API plus OpenWebUI, it combines real-time SearXNG searches with a vectorized database of my own notes to generate context-aware responses. The gravy on top: everything runs in Docker containers on my homelab Unraid server for easy deployment and maintenance. Reference: https://www.youtube.com/watch?v=T-D1OfcDW1M
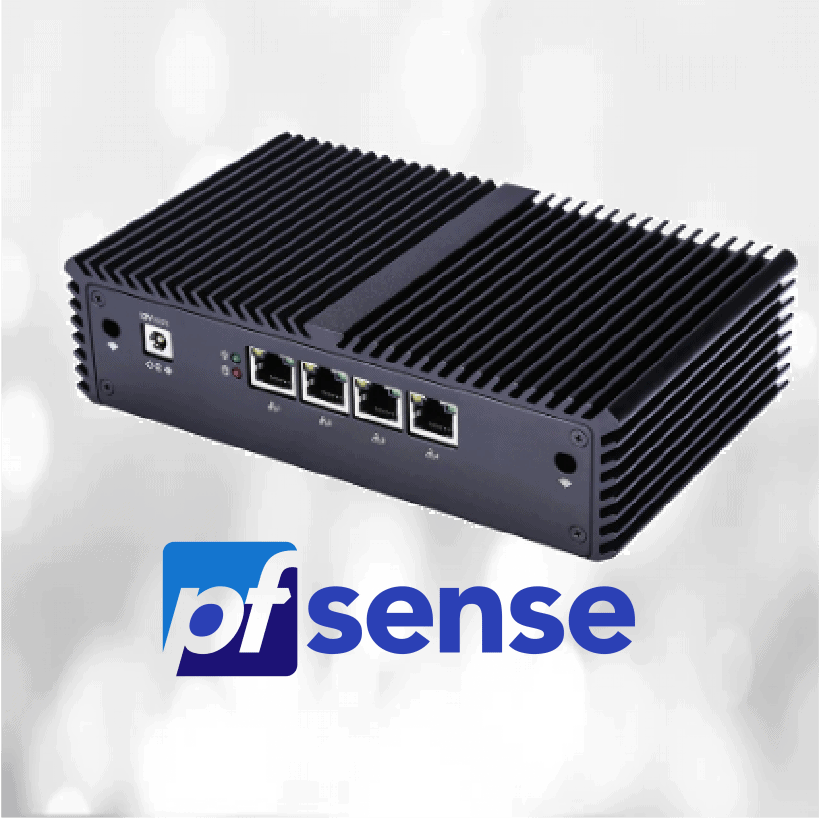
pfSense Network Security LAB
PFSENSE NETWORK SECURITY LAB Overview: Designed and deployed a network security environment using pfSense firewall on a Protectli Vault appliance and Unifi access points (APs). Implemented Snort for real-time Intrusion Detection and Prevention (IDS/IPS) and IP block lists to increase security. Configured pfSense as an internal Certificate Authority (CA) to manage and issue SSL certificates for encrypting internal communications with self-hosted services. Deployed Tailscale (WireGuard-based) and OpenVPN for remote-access VPN connectivity. pfSense® software is a free, open source customized distribution of FreeBSD specifically tailored for use as a firewall and router that is entirely managed via web interface. Nothing scratches my networking itch like designing a network from the ground up and seeing all the pieces work together (or not work together—troubleshooting is half the fun, right?). So when I got my hands on a Protectli Vault and some Unifi access points, I knew it was time to build out the kind of network security lab I’d always wanted: more configurable than any consumer-grade router and, quite frankly, completely overkill. The foundation of this lab is pfSense, which acts as my firewall and router. Security is my priority, so setting up real-time Intrusion Detection and Prevention with Snort and building out custom IP blocklists was a must. Setting up pfSense as my internal Certificate Authority was a personal achievement. There’s something satisfying about generating and issuing your own SSL certificates for all your self-hosted services and getting rid of those pesky “This site is insecure” messages. But it wasn’t just about locking things down locally—I wanted encrypted remote access as well. So I configured Tailscale and, for good measure, OpenVPN. Both play nicely with pfSense and give me secure access to my local network from anywhere. This whole lab was a sandbox for skills in network segmentation, IDS/IPS best practices, and remote access VPNs. It was a lot of fun to tinker with all the settings and tune my network to behave exactly how I want it to. Reference: https://www.youtube.com/watch?v=lUzSsX4T4WQ
3D Printing a Life-Size Replica of my Brain
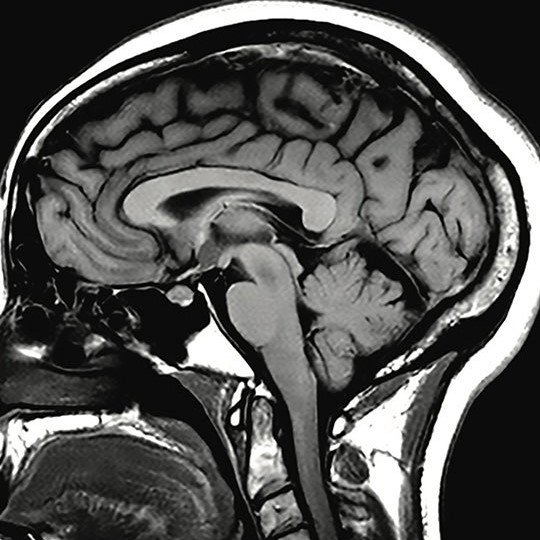
3D PRINTING A LIFE-SIZE REPLICA OF MY BRAIN Overview: Processed MRI DICOM files to reconstruct 3D brain anatomy using FreeSurfer command-line tools. Cleaned and optimized complex 3D mesh data in Blender to create a printable, refined model. Operated and maintained an Ender 3 Pro 3D printer, configuring slicing settings and selecting filament for large-scale prints. When I was in the hospital getting an MRI, I couldn’t resist the urge to ask the technician for the raw image files. It was just too cool not to do a project with. So I set myself the purely scientific (and partially self-indulgent) goal of 3D printing a life-size replica of my own brain—it’s a conversation starter for sure. The project started with an MRI scan of my head. The raw files I received were a series of 2D images, which are not very useful for my purposes (although they could make for some eerily spooky Halloween art). I used the command-line tool FreeSurfer to interpolate the MRI images, isolating just the brain matter from the skull. FreeSurfer isn’t the most user-friendly tool out there and is mostly used for medical purposes, but after some trial and error, I had the beautiful, wrinkly brain mesh exported as an STL file. Of course, the mesh was nowhere near print-ready, so that’s where Blender came in. A mesh cleanup session in Blender took care of various rough edges and extraneous vertices. Finally ready for print, I sent the model to my Ender 3 Pro and loaded it up with bubblegum pink filament, how appetizing. All in all, it’s equal parts neuroscience, digital sculpting, and 3D printing—plus, it makes for the weirdest paperweight you’ll ever see. If you have the files and a printer, I can’t recommend printing your own brain enough. But if you don’t happen to have an MRI scan of your own brain lying around, feel free to use mine that I’ve uploaded to Thingiverse here.
The Ultimate Smart Home Dashboard (Grafana)
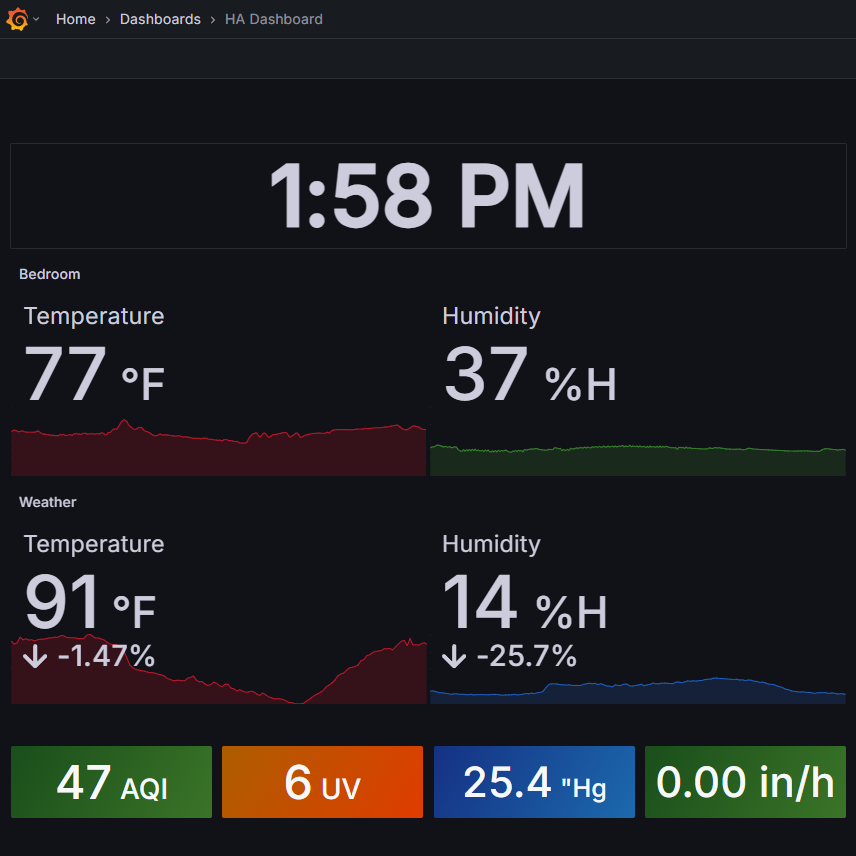
THE ULTIMATE SMART HOME DASHBOARD (GRAFANA) Overview: Deployed Grafana as a centralized dashboard platform for real-time data visualization. Integrated Home Assistant with InfluxDB to collect and store sensor and smart home data for historic analysis. Customized dashboards and visualizations within Grafana to monitor system metrics and sensors. Encrypted access using an Nginx reverse proxy and a local Certificate Authority. Grafana is the open source analytics & monitoring solution for every database. I love graphs, and who doesn’t? Okay, maybe it’s a niche interest, but for me, there’s nothing quite as satisfying as a good graph. So when I first heard about Grafana, I knew I had to give it a try. So, what is Grafana? Grafana is a web application that lets you connect to an external database and create interactive dashboards. The great thing is that the data source can be just about anything: computers, switches, network devices, and (my personal favorite) smart home sensors. Grafana takes all that data and consolidates it into a single dashboard, eliminating the need to troubleshoot across a dozen different tabs when hunting down a problem. For my setup, I started by connecting Grafana to Home Assistant. Home Assistant collects all sorts of sensor values, like whether my front door is open (again) or if the bathroom humidity spikes from an extra-steamy shower. I feed this data into InfluxDB, a time-series database that Grafana can easily understand. Once the data is in InfluxDB, Grafana can use the database for visualizations. To make it more secure, I put everything behind an Nginx reverse proxy. This keeps access to my dashboards encrypted. All in all, Grafana is a fantastic tool for monitoring all kinds of data and has been helpful more than once for observing trends and tracking down issues in my smart home automations. A graph for monitoring my temperature sensors over a 24 hour period